はじめに
前回の記事にて、周波数特性を直接指定してFIRフィルタを設計する方法である窓関数法のPythonコードを紹介しました。
今回は、GUIを使用してインタラクティブに設計できるようにしてみようと思います。
PythonでのGUIの扱い
どの言語を用いても多かれ少なかれGUIの扱いは面倒です。PythonでGUIを扱う方法はいくつかありますが、グラフ表示で使うmatplotlibの機能に限定して使うと、インポートするパッケージが少なく済み、他の方法に比べて見通しがよくなります。
matplotlibはグラフ表示だけでなく、ラジオボタンやスライダーを配置することができます。これらが更新された際動作させたい関数をコールバック関数として紐づけるだけの簡単な使い方です。
とはいえ手動で作るのは面倒ですので、今回はgrokに手伝ってもらいました。
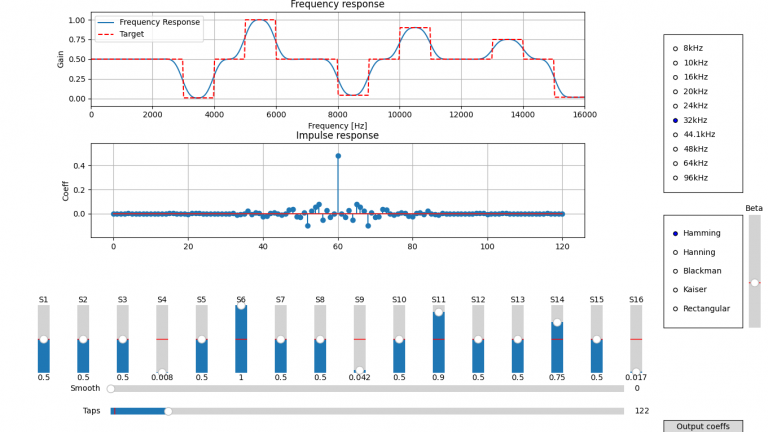
作成した設計ツール

16本のスライダーでターゲットの周波数特性を指定し、その他パラメータもスライダーやラジオボタンで指定します。
ボタンを押すとコンソールに設計した係数を表示します。
ソースコード
Pythonのバージョンは3.13.5です。
import matplotlib.pyplot as plt
from matplotlib.widgets import Slider, Button, RadioButtons
import numpy as np
from scipy import signal
from scipy.ndimage import gaussian_filter1d

# フィルタ係数とタップ数をグローバル変数として定義
coeff = None
taps_g = 16
fs_g = 48e3  # 初期サンプリング周波数
window_g = 'Hamming'  # 初期窓関数
beta_g = 8.0  # 初期ベータ値(Kaiser窓用)
smooth_g = 0  # 初期スムージング値

def design_fir_filter(f_norm, fs=48e3, taps=taps_g, window='Hamming', beta=8.0, smooth=0):
    """
    FIRフィルタのインパルス応答を設計する関数
    Parameters:
    f_norm (ndarray): ノーマライズされた周波数特性(スライダーの値)
    fs (float): サンプリング周波数 (Hz)
    taps (int): フィルタのタップ数
    window (str): 窓関数の種類 ('Hamming', 'Hanning', 'Blackman', 'Kaiser', 'Rectangular')
    beta (float): Kaiser窓のベータ値
    smooth (float): ガウスフィルタのスムージングパラメータ
    Returns:
    tuple: (指定された窓関数を適用したインパルス応答, ガウスフィルタ適用後のf_norm)
    """
    f_size = f_norm.shape[0]

    # ゼロ次ホールド補完でf_normを512点にリサンプリング
    x_new = np.linspace(0, f_size, 512)
    indices = np.clip(np.floor(x_new).astype(int), 0, f_size-1)  # 最も近いインデックスを計算
    f_norm_plot = f_norm[indices]  # ゼロ次ホールド(最近傍点の値を使用)

    while f_size < taps:
        f_norm = f_norm[(np.arange(0, f_norm.shape[0], 0.5)).astype('int32')]
        f_size *= 2

    if smooth > 0:
        f_norm = gaussian_filter1d(f_norm, f_norm.shape[0] / 64 * smooth)
        f_norm_plot = gaussian_filter1d(f_norm_plot, f_norm_plot.shape[0] / 64 * smooth)

    # 偶数タップの場合、周波数特性を調整
    if taps % 2 == 0:
        f_norm = np.concatenate([f_norm * 2, np.zeros(f_norm.shape[0])])

    # 鏡像の付加
    f_norm = np.concatenate([f_norm, f_norm[-1:0:-1]])

    # 逆フーリエ変換でインパルス応答を計算
    ifft_out = np.real(np.fft.ifft(f_norm))
    ifft_shift = np.fft.fftshift(ifft_out)

    # 偶数タップの場合、インパルス応答を間引く
    if taps % 2 == 0:
        ifft_shift = ifft_shift[0::2]

    # 矩形窓の切り出し
    center = np.floor(ifft_shift.shape[0] / 2)
    start_point = int(center - np.floor(taps / 2))
    end_point = int(center + np.ceil(taps / 2))
    impulse_rect = ifft_shift[start_point:end_point]

    # 窓関数を適用
    if window == 'Hamming':
        w = np.hamming(taps)
    elif window == 'Hanning':
        w = np.hanning(taps)
    elif window == 'Blackman':
        w = np.blackman(taps)
    elif window == 'Kaiser':
        w = np.kaiser(taps, beta)
    else:  # Rectangular
        w = np.ones(taps)

    impulse_window = impulse_rect * w
    return impulse_window, f_norm_plot

# フィギュアを作成(サイズを調整してスライダー用のスペースを確保)
fig = plt.figure(figsize=(14, 8))
plt.subplots_adjust(bottom=0.45, top=0.95, hspace=0.4, right=0.75)

# 1段目:周波数応答を表示する折れ線グラフ
ax_graph = fig.add_subplot(211)
# 2段目:フィルタ係数を表示するステムプロット
ax_stem = fig.add_subplot(212)
# 3段目:スライダー配置用のサブプロット(軸は非表示)
ax_sliders = fig.add_subplot(313)
ax_sliders.set_axis_off()

# 垂直スライダーの数(16本)
num_sliders = 16

# スライダーの初期値(全て0.5)
slider_values = [0.5] * num_sliders

# 折れ線グラフを初期化(1段目)
x = np.linspace(0, fs_g/2, 512)  # X軸:0~fs/2(ナイキスト周波数)
line, = ax_graph.plot(x, np.ones(512)*0.5, label='Frequency Response')
line_fnorm, = ax_graph.plot(x, np.ones(512)*0.5, 'r--', label='Target')  # 赤いプロットを破線
ax_graph.set_ylabel('Gain')
ax_graph.set_xlabel('Frequency [Hz]')
ax_graph.set_title('Frequency response')
ax_graph.grid(True)
ax_graph.legend()

# ステムプロットを初期化(2段目)
stem_x = np.arange(taps_g)
stem_y = np.zeros(taps_g)
ax_stem.stem(stem_x, stem_y)
ax_stem.set_ylim(-0.5, 0.5)
ax_stem.set_ylabel('Coeff')
ax_stem.set_title('Impulse response')
ax_stem.grid(True)

# ラジオボタンを追加(周波数応答プロットの右側)
fs_options = ['8kHz', '10kHz', '16kHz', '20kHz', '24kHz', '32kHz', '44.1kHz', '48kHz', '64kHz', '96kHz']
fs_values = [8000, 10000, 16000, 20000, 24000, 32000, 44100, 48000, 64000, 96000]
ax_radio_fs = fig.add_axes([0.85, 0.55, 0.1, 0.35])
radio_fs = RadioButtons(ax_radio_fs, fs_options, active=fs_options.index('48kHz'))

# 窓関数選択用のラジオボタンを追加(fsラジオボタンの下)
window_options = ['Hamming', 'Hanning', 'Blackman', 'Kaiser', 'Rectangular']
ax_radio_window = fig.add_axes([0.85, 0.25, 0.1, 0.25])
radio_window = RadioButtons(ax_radio_window, window_options, active=window_options.index('Hamming'))

# Kaiser窓のベータ値用スライダーを追加(窓関数ラジオボタンの右側)
ax_beta = fig.add_axes([0.95, 0.25, 0.03, 0.25])
beta_slider = Slider(
    ax=ax_beta,
    label='Beta',
    valmin=0,
    valmax=20,
    valinit=beta_g,
    orientation='vertical'
)
beta_slider.valtext.set_visible(False)
beta_slider.poly.set_visible(False)

# スムージング用スライダーを追加(tapsスライダーの上、同じ長さ)
ax_smooth = fig.add_axes([0.15, 0.10, 0.65, 0.03])
smooth_slider = Slider(
    ax=ax_smooth,
    label='Smooth',
    valmin=0,
    valmax=10,
    valinit=smooth_g,
    orientation='horizontal'
)

# 垂直スライダーの値が変更されたときのコールバック関数
def update(val, index):
    global coeff, taps_g, fs_g, window_g, beta_g, smooth_g
    slider_values[index] = sliders[index].val
    coeff, f_norm_plot = design_fir_filter(np.array(slider_values), fs_g, taps_g, window_g, beta_g, smooth_g)
    # 周波数応答を更新
    freq_response = abs(np.fft.fft(coeff, 1024))[0:512]
    line.set_ydata(freq_response)
    line_fnorm.set_ydata(f_norm_plot)  # ガウスフィルタ適用後のf_normを更新
    y_min, y_max = min(np.min(freq_response), np.min(f_norm_plot)), max(np.max(freq_response), np.max(f_norm_plot))
    margin = (y_max - y_min) * 0.1 if y_max != y_min else 0.1
    ax_graph.set_ylim(y_min - margin, y_max + margin)
    # ステムプロットを更新
    ax_stem.clear()
    stem_x = np.arange(taps_g)
    ax_stem.stem(stem_x, coeff)
    ax_stem.set_ylim(np.min(coeff) - 0.1, np.max(coeff) + 0.1)
    ax_stem.set_ylabel('Coeff')
    ax_stem.set_title('Impulse response')
    ax_stem.grid(True)
    fig.canvas.draw_idle()

# スムージングスライダーのコールバック関数
def update_smooth(val):
    global coeff, fs_g, taps_g, window_g, beta_g, smooth_g
    smooth_g = smooth_slider.val
    coeff, f_norm_plot = design_fir_filter(np.array(slider_values), fs_g, taps_g, window_g, beta_g, smooth_g)
    # 周波数応答を更新
    freq_response = abs(np.fft.fft(coeff, 1024))[0:512]
    line.set_ydata(freq_response)
    line_fnorm.set_ydata(f_norm_plot)  # ガウスフィルタ適用後のf_normを更新
    y_min, y_max = min(np.min(freq_response), np.min(f_norm_plot)), max(np.max(freq_response), np.max(f_norm_plot))
    margin = (y_max - y_min) * 0.1 if y_max != y_min else 0.1
    ax_graph.set_ylim(y_min - margin, y_max + margin)
    # ステムプロットを更新
    ax_stem.clear()
    stem_x = np.arange(taps_g)
    ax_stem.stem(stem_x, coeff)
    ax_stem.set_ylim(np.min(coeff) - 0.1, np.max(coeff) + 0.1)
    ax_stem.set_ylabel('Coeff')
    ax_stem.set_title('Impulse response')
    ax_stem.grid(True)
    fig.canvas.draw_idle()

smooth_slider.on_changed(update_smooth)

# 垂直スライダーを作成
sliders = []
for i in range(num_sliders):
    ax_slider = fig.add_axes([0.05 + i*0.05, 0.15, 0.03, 0.15])
    slider = Slider(
        ax=ax_slider,
        label=f'S{i+1}',
        valmin=0,
        valmax=1,  # 値の範囲を0~1に変更
        valinit=0.5,  # 初期値を0.5に変更
        orientation='vertical'
    )
    sliders.append(slider)
    slider.on_changed(lambda val, idx=i: update(val, idx))

# タップ数用の水平スライダーを作成
ax_taps = fig.add_axes([0.15, 0.05, 0.65, 0.03])
taps_slider = Slider(
    ax=ax_taps,
    label='Taps',
    valmin=8,
    valmax=1024,
    valinit=taps_g,
    orientation='horizontal'
)

# タップ数が変更されたときのコールバック関数
def update_taps(val):
    global coeff, taps_g, fs_g, window_g, beta_g, smooth_g
    taps_g = int(taps_slider.val)
    coeff, f_norm_plot = design_fir_filter(np.array(slider_values), fs_g, taps_g, window_g, beta_g, smooth_g)
    # 周波数応答を更新
    freq_response = abs(np.fft.fft(coeff, 1024))[0:512]
    line.set_ydata(freq_response)
    line_fnorm.set_ydata(f_norm_plot)  # ガウスフィルタ適用後のf_normを更新
    y_min, y_max = min(np.min(freq_response), np.min(f_norm_plot)), max(np.max(freq_response), np.max(f_norm_plot))
    margin = (y_max - y_min) * 0.1 if y_max != y_min else 0.1
    ax_graph.set_ylim(y_min - margin, y_max + margin)
    # ステムプロットを更新
    ax_stem.clear()
    stem_x = np.arange(taps_g)
    ax_stem.stem(stem_x, coeff)
    ax_stem.set_ylim(np.min(coeff) - 0.1, np.max(coeff) + 0.1)
    ax_stem.set_ylabel('Coeff')
    ax_stem.set_title('Impulse response')
    ax_stem.grid(True)
    fig.canvas.draw_idle()

taps_slider.on_changed(update_taps)

# fsラジオボタンのコールバック関数
def update_fs(label):
    global coeff, fs_g, window_g, beta_g, smooth_g
    fs_g = fs_values[fs_options.index(label)]
    x = np.linspace(0, fs_g/2, 512)
    line.set_xdata(x)
    line_fnorm.set_xdata(x)  # f_normのX軸も更新
    ax_graph.set_xlim(0, fs_g/2)
    ax_graph.set_xlabel('Frequency [Hz]')
    coeff, f_norm_plot = design_fir_filter(np.array(slider_values), fs_g, taps_g, window_g, beta_g, smooth_g)
    # 周波数応答を更新
    freq_response = abs(np.fft.fft(coeff, 1024))[0:512]
    line.set_ydata(freq_response)
    line_fnorm.set_ydata(f_norm_plot)  # ガウスフィルタ適用後のf_normを更新
    y_min, y_max = min(np.min(freq_response), np.min(f_norm_plot)), max(np.max(freq_response), np.max(f_norm_plot))
    margin = (y_max - y_min) * 0.1 if y_max != y_min else 0.1
    ax_graph.set_ylim(y_min - margin, y_max + margin)
    # ステムプロットを更新
    ax_stem.clear()
    stem_x = np.arange(taps_g)
    ax_stem.stem(stem_x, coeff)
    ax_stem.set_ylim(np.min(coeff) - 0.1, np.max(coeff) + 0.1)
    ax_stem.set_ylabel('Coeff')
    ax_stem.set_title('Impulse response')
    ax_stem.grid(True)
    fig.canvas.draw_idle()

radio_fs.on_clicked(update_fs)

# 窓関数ラジオボタンのコールバック関数
def update_window(label):
    global coeff, fs_g, taps_g, window_g, beta_g, smooth_g
    window_g = label
    # ベータスライダーの有効/無効を切り替え
    if window_g == 'Kaiser':
        beta_slider.valtext.set_visible(True)
        beta_slider.poly.set_visible(True)
    else:
        beta_slider.valtext.set_visible(False)
        beta_slider.poly.set_visible(False)
    coeff, f_norm_plot = design_fir_filter(np.array(slider_values), fs_g, taps_g, window_g, beta_g, smooth_g)
    # 周波数応答を更新
    freq_response = abs(np.fft.fft(coeff, 1024))[0:512]
    line.set_ydata(freq_response)
    line_fnorm.set_ydata(f_norm_plot)  # ガウスフィルタ適用後のf_normを更新
    y_min, y_max = min(np.min(freq_response), np.min(f_norm_plot)), max(np.max(freq_response), np.max(f_norm_plot))
    margin = (y_max - y_min) * 0.1 if y_max != y_min else 0.1
    ax_graph.set_ylim(y_min - margin, y_max + margin)
    # ステムプロットを更新
    ax_stem.clear()
    stem_x = np.arange(taps_g)
    ax_stem.stem(stem_x, coeff)
    ax_stem.set_ylim(np.min(coeff) - 0.1, np.max(coeff) + 0.1)
    ax_stem.set_ylabel('Coeff')
    ax_stem.set_title('Impulse response')
    ax_stem.grid(True)
    fig.canvas.draw_idle()

radio_window.on_clicked(update_window)

# ベータスライダーのコールバック関数
def update_beta(val):
    global coeff, fs_g, taps_g, window_g, beta_g, smooth_g
    beta_g = beta_slider.val
    if window_g == 'Kaiser':
        coeff, f_norm_plot = design_fir_filter(np.array(slider_values), fs_g, taps_g, window_g, beta_g, smooth_g)
        # 周波数応答を更新
        freq_response = abs(np.fft.fft(coeff, 1024))[0:512]
        line.set_ydata(freq_response)
        line_fnorm.set_ydata(f_norm_plot)  # ガウスフィルタ適用後のf_normを更新
        y_min, y_max = min(np.min(freq_response), np.min(f_norm_plot)), max(np.max(freq_response), np.max(f_norm_plot))
        margin = (y_max - y_min) * 0.1 if y_max != y_min else 0.1
        ax_graph.set_ylim(y_min - margin, y_max + margin)
        # ステムプロットを更新
        ax_stem.clear()
        stem_x = np.arange(taps_g)
        ax_stem.stem(stem_x, coeff)
        ax_stem.set_ylim(np.min(coeff) - 0.1, np.max(coeff) + 0.1)
        ax_stem.set_ylabel('Coeff')
        ax_stem.set_title('Impulse response')
        ax_stem.grid(True)
        fig.canvas.draw_idle()

beta_slider.on_changed(update_beta)

# 初期のフィルタ係数を計算
coeff, f_norm_plot = design_fir_filter(np.array(slider_values), fs_g, taps_g, window_g, beta_g, smooth_g)

# 初期の周波数応答をプロット
freq_response = abs(np.fft.fft(coeff, 1024))[0:512]
line.set_ydata(freq_response)
line_fnorm.set_ydata(f_norm_plot)  # 初期のガウスフィルタ適用後のf_normをプロット
y_min, y_max = min(np.min(freq_response), np.min(f_norm_plot)), max(np.max(freq_response), np.max(f_norm_plot))
margin = (y_max - y_min) * 0.1 if y_max != y_min else 0.1
ax_graph.set_ylim(y_min - margin, y_max + margin)
ax_graph.set_xlim(0, fs_g/2)

# 初期のステムプロットを更新
ax_stem.clear()
stem_x = np.arange(taps_g)
ax_stem.stem(stem_x, coeff)
ax_stem.set_ylim(np.min(coeff) - 0.1, np.max(coeff) + 0.1)
ax_stem.set_ylabel('Coeff')
ax_stem.set_title('Impulse response')
ax_stem.grid(True)

# ボタンを作成
ax_button = fig.add_axes([0.85, 0.015, 0.1, 0.03])
button = Button(ax_button, 'Output coeffs')

# ボタンがクリックされたときのコールバック関数
def button_callback(event):
    global coeff
    print("coeff:", coeff)

button.on_clicked(button_callback)

# GUIを表示
plt.show()
おわりに
このようにGUIでFIRフィルタを設計できると、タップ数や窓関数のかけ方が実際にどのような影響を及ぼすのか視覚的に理解できます。
一通り遊んだら、用途に合わせてカスタマイズしてみてください。
著者プロフィール
- Cerevo 電気エンジニア
最近の投稿
 02. ソフトウェア2025.07.30インタラクティブに設計するディジタルフィルタ
 02. ソフトウェア2025.07.23とにかくラフに設計するディジタルフィルタ
 11. その他2025.07.16CP210xシリーズのCOM番号とUSBハブ上の差し込みポートを紐づける
 11. その他2025.07.09アリエク調達のアンプでアクティブプローブを作成する


